Pandas merging
Pandas and its amazingness
The pandas package in Python, is the most common and powerful tool to handle tabular data, such as the very common csv tables. I must admit it takes a bit of time to get familiar with how pandas handle the data and how to properly filter by row or column without checking the documentation every minute, but it’s a must-use tool nonetheless.
Merging with Pandas
A specific situation that I find myself in many times, and that I never remeber how to address is how to cleverly use Pandas merge in order to multiply entries. Let me explain better.
Merging in Pandas is very easy, you simply specify the column on which you want to merge 2 Pandas dataframe. As long as the common column is identical the merge will be successful, and there are ways to handle cases in which the 2 dataframes don’t have the same number or identity of rows.
The use that I refer to is when you want to repeat (or multiply entries) in your Pandas dataframe because you need each row of your dataframe to have a number to make an operation. For example if I want to sum together 2 columns, I need to have a pair between column 1 and column 2 in each row, I cannot do that operation otherwise. But in some case you might want to sum each row of your dataframe by the first say 5 rows without having a 1-to-1 correspondence. That’s the thing I always forget how to do.
Multiplying entries using Pandas merge
A typical case for me is to have data I extracted from fluorescent images of cells doing something. I usually have different cells, several time points and an intensity value associated with the particular cell and time point.
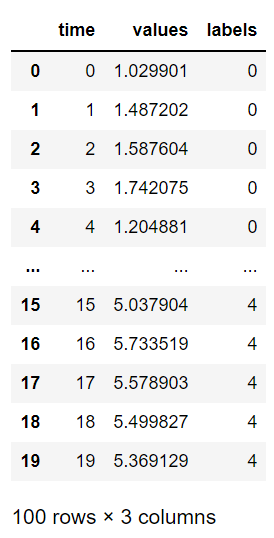
Here I create some random data, let’s say I have a dataframe that looks like this:
number_cells = 5
df = pd.DataFrame()

for idx in range(number_cells):
    time_array = np.arange(20)
    values_array = np.random.random(20)+idx+1
    label_array = np.repeat(idx, 20)

    df_dict = {"time": time_array,
              "values": values_array,
              "labels": label_array}
    df = pd.concat([df, pd.DataFrame(df_dict)])
This will create a table that looks like this.
Let’s say I want to display this time-series data to check by eye some patterns.
sns.set_context("talk")
g = sns.lineplot(data=df, x='time', y='values', hue='labels', palette=sns.color_palette("Paired", as_cmap=True))
g.set(title='Not normalized intensities in time', ylabel='Values', xlabel='Time (min)')
g.legend(bbox_to_anchor=(1,0.8))
plt.tight_layout()
plt.show()
Returns
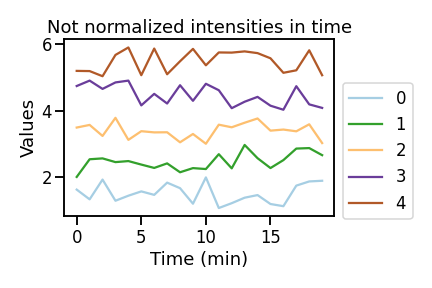
As you can see these fake cells oscillate randomly up and down around arbitrary values. But let’s say that in order to compare their behaviour I want to normalize them to the first value (or any other) so that I would “squeeze” my data range around 1 instead of having it from 0 all the way to 6. To do so we just need to divide each value of each cell by the first intensity value.
Now my eternal question is: how do I divide every value on the dataframe by the corresponding first time point value if I don’t have it repeated in every row? With merge! Here’s how:
df_time0 = df.loc[df.time == 0, ['labels', 'values']] # extract values to normalize with
df_time0.columns = ['labels', 'values_time0'] # rename columns to avoid conflict when merging
df_tot = df.merge(df_time0, on='labels') # merge with original full dataframe
df_tot['values_norm'] = df_tot['values'] / df_tot['values_time0'] # actually do the normalization
And just like that we end up with this!
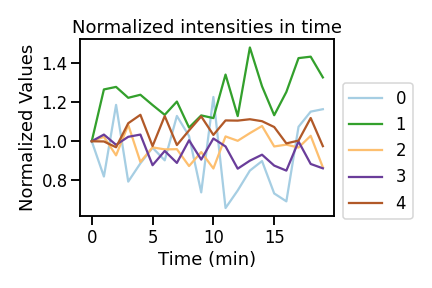
Here we can easily compare heterogeneous cells together on the same intensity scale to check for patterns.
SOURCE
You can find the complete python script used for this post here.
Leave a comment